|
Learn more about creating an odor descriptor map from your data in your Odor Track'r odor monitoring database.
| |
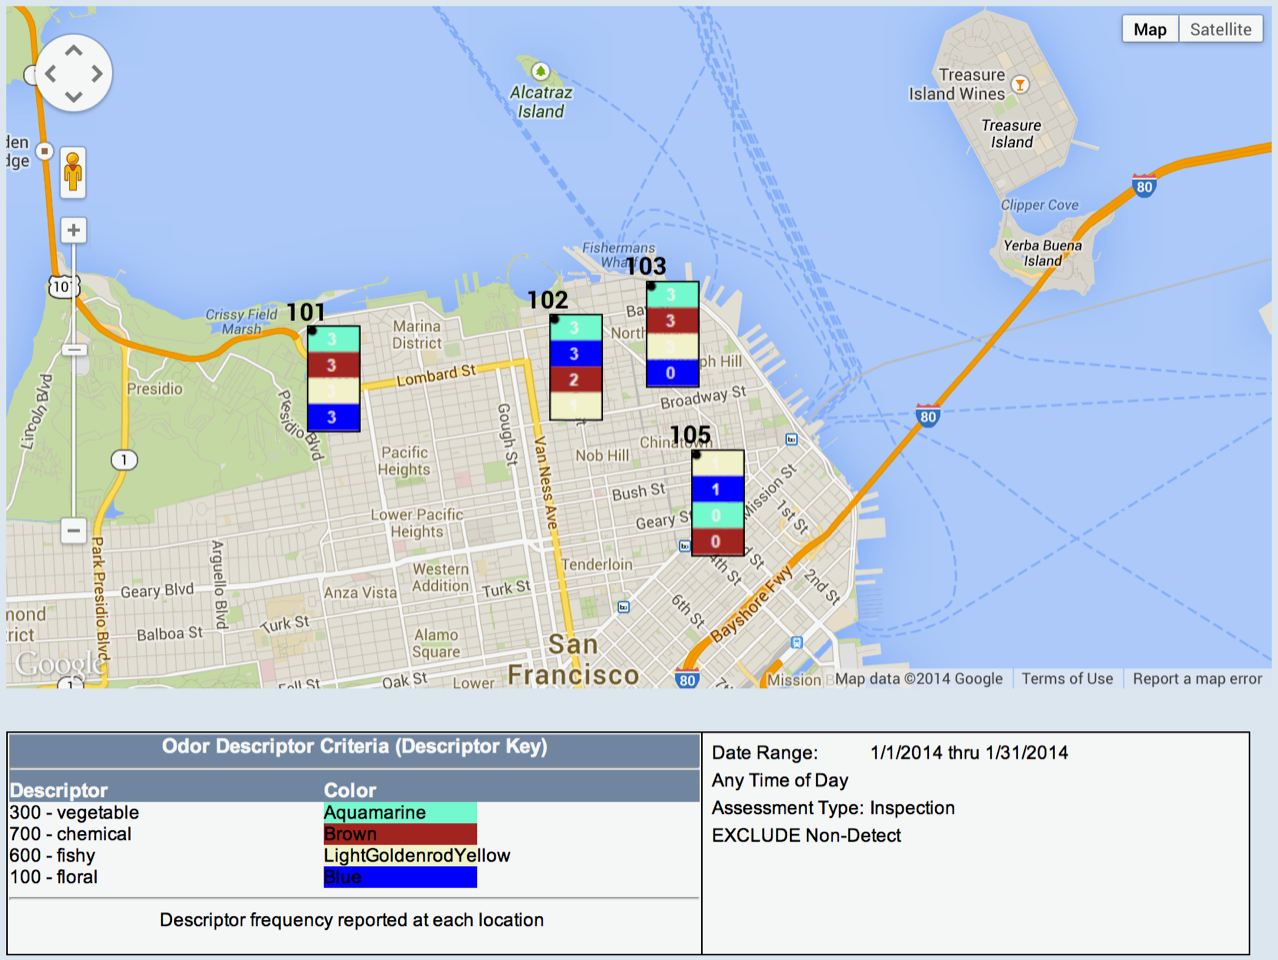
This Google Map image is created in the video tutorial below. |
| |
 |
| |
|
For optimum viewing experience, click the framed box in the lower right corner of the video for full screen view.
Additional Tips
#1. Select dark colors for the descriptors; you will then easily read the white descriptor frequency numbers within the color bars.
#2. The example map and video tutorial above use Red and Blue colors to illustrate the ease of reading the white frequency number in the chevron bars. the light aquamarine and light yellow colors illustrate the difficulty in reading the white frequency numbers in the chevron bars.
Google Earth Version of Odor Descriptor Map

|
Note: The data shown in the Odor Track'r Program how to videos are fiction and were created for illustrative purposes only.
|
|