|
Learn more about create an odor eclipse map from your data in your Odor Track'r odor monitoring database.
| |
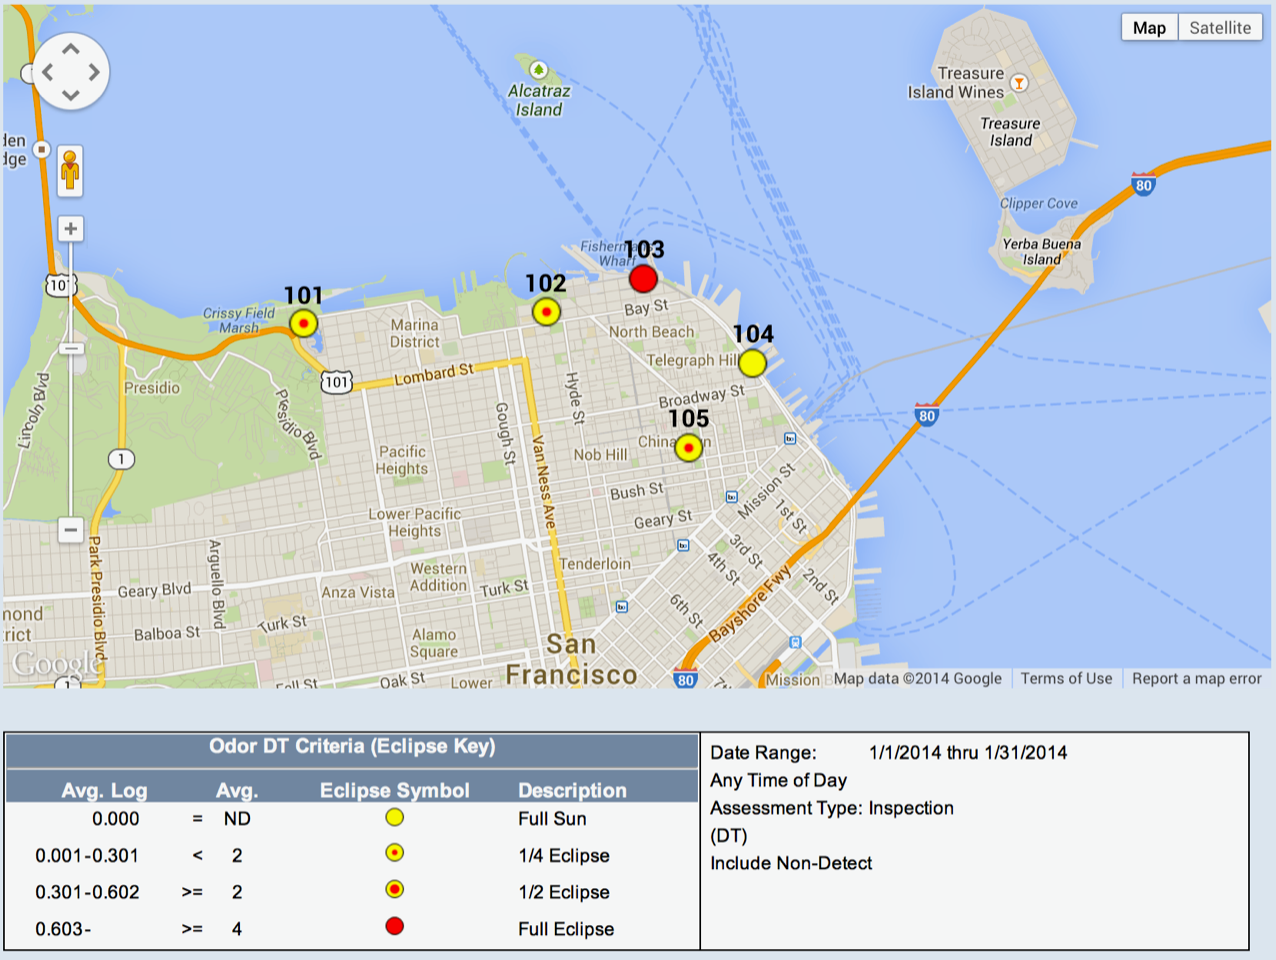
This Google Map image is created in the video tutorial below. |
| |
 |
| |
|
For optimum viewing experience, click the framed box in the lower right corner of the video for full screen view.
Additional Tips
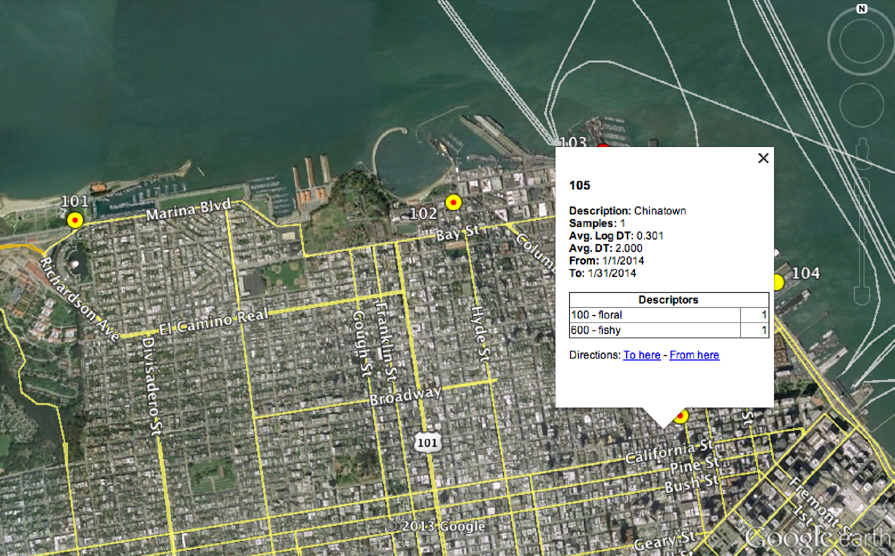
#1. Within Google Earth or Google Maps, click a location to view summary data (see image below).
#2. Select the D/T odor strength ranges for the Eclipse (Full Sun, 1/4 Eclipse, 1/2 Eclipse, Full Eclipse) to "tell your story" with the data. For example, the Full Eclipse symbol may be set to "7-D/T" if the statutory odor limit is 7.
#3. Check the box "Include Non-Detects" to use all data for the search criteria date/time range. The box is un-checked by default to exclude the non-detect odor inspection observations. This provides a summary of results when odor was detected vs a summary of results of all inspections.
#4. Select the Eclipse "Inner Circle" and "Outer Circle" colors for your odor story telling. Different color choices may help differentiate maps with different search criteria. Consider the ease of seeing the Eclipse colors on Google Maps and Google Earth; some colors do not "jump" from the maps as well as other colors.
Google Earth Version of Odor Eclipse Map. Location is highlighted with summary data.
|
Note: The data shown in the Odor Track'r Program how to videos are fiction and were created for illustrative purposes only.
|
|